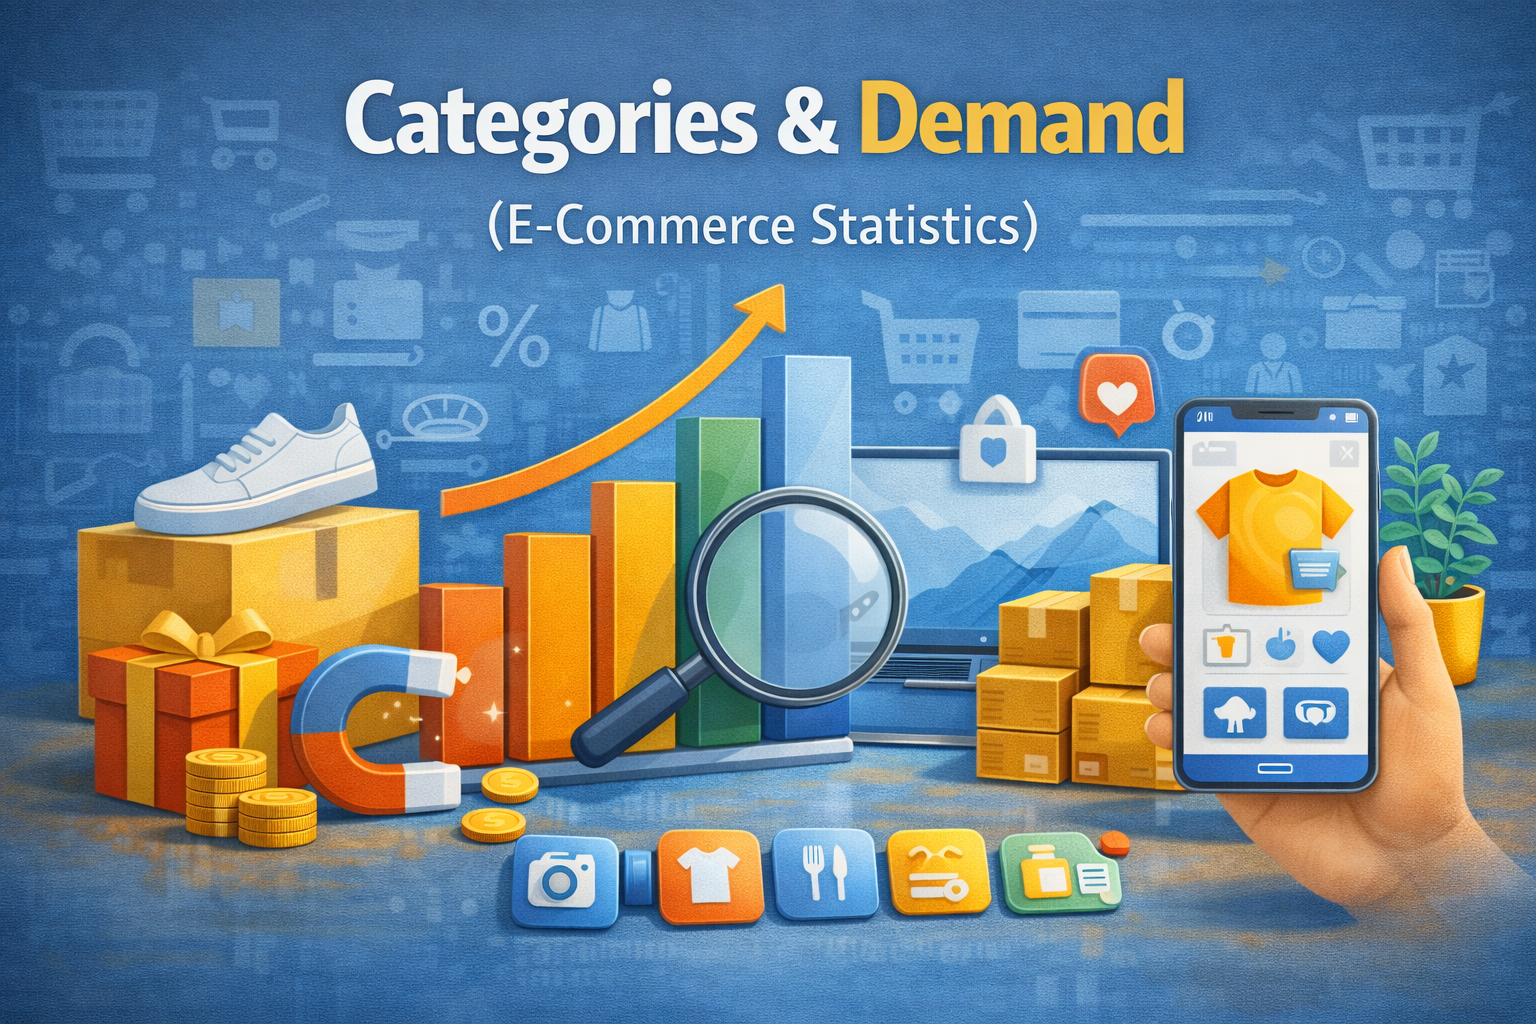
Categories and demand benchmarks explain what shoppers buy online and how category mix shapes market narratives. This silo groups category-level
stats used in reports: category mix, top categories by revenue, and category-specific signals (beauty, apparel, electronics).
Back to the hub:
E-commerce Statistics.
If you only read two pages here, start with
category mix in e-commerce sales
and top e-commerce categories by revenue.
Featured (start here)
The most useful pages for “what sells online” narratives and category benchmarking.
Category mix in e-commerce sales
Benchmark how e-commerce revenue is distributed across major categories.
Top e-commerce categories by revenue
A citation-friendly list of the highest-revenue categories in e-commerce.
Apparel e-commerce return rate
Category-level return-rate signal often used to explain profitability and reverse-logistics load.
Category reporting works best when paired with market context:
global market size and
ecommerce share of retail.
Pages in this silo
These links are prepared so you won’t need to edit this silo page later as you publish.
How to use category & demand benchmarks
A simple structure for research-grade category analysis.
- Start with category mix. Use mix to explain why “e-commerce looks like it’s growing” in some categories faster than others.
- Add a top categories list. Top categories by revenue makes content instantly scannable and citable.
- Use 1–2 category deep-dives. Beauty/apparel/electronics examples help explain different behaviors (returns, conversion, ticket size).
- Connect to funnel outcomes. Category differences often show up in conversion and returns.
Reference pages used across the hub:
Methodology •
Glossary •
Sources