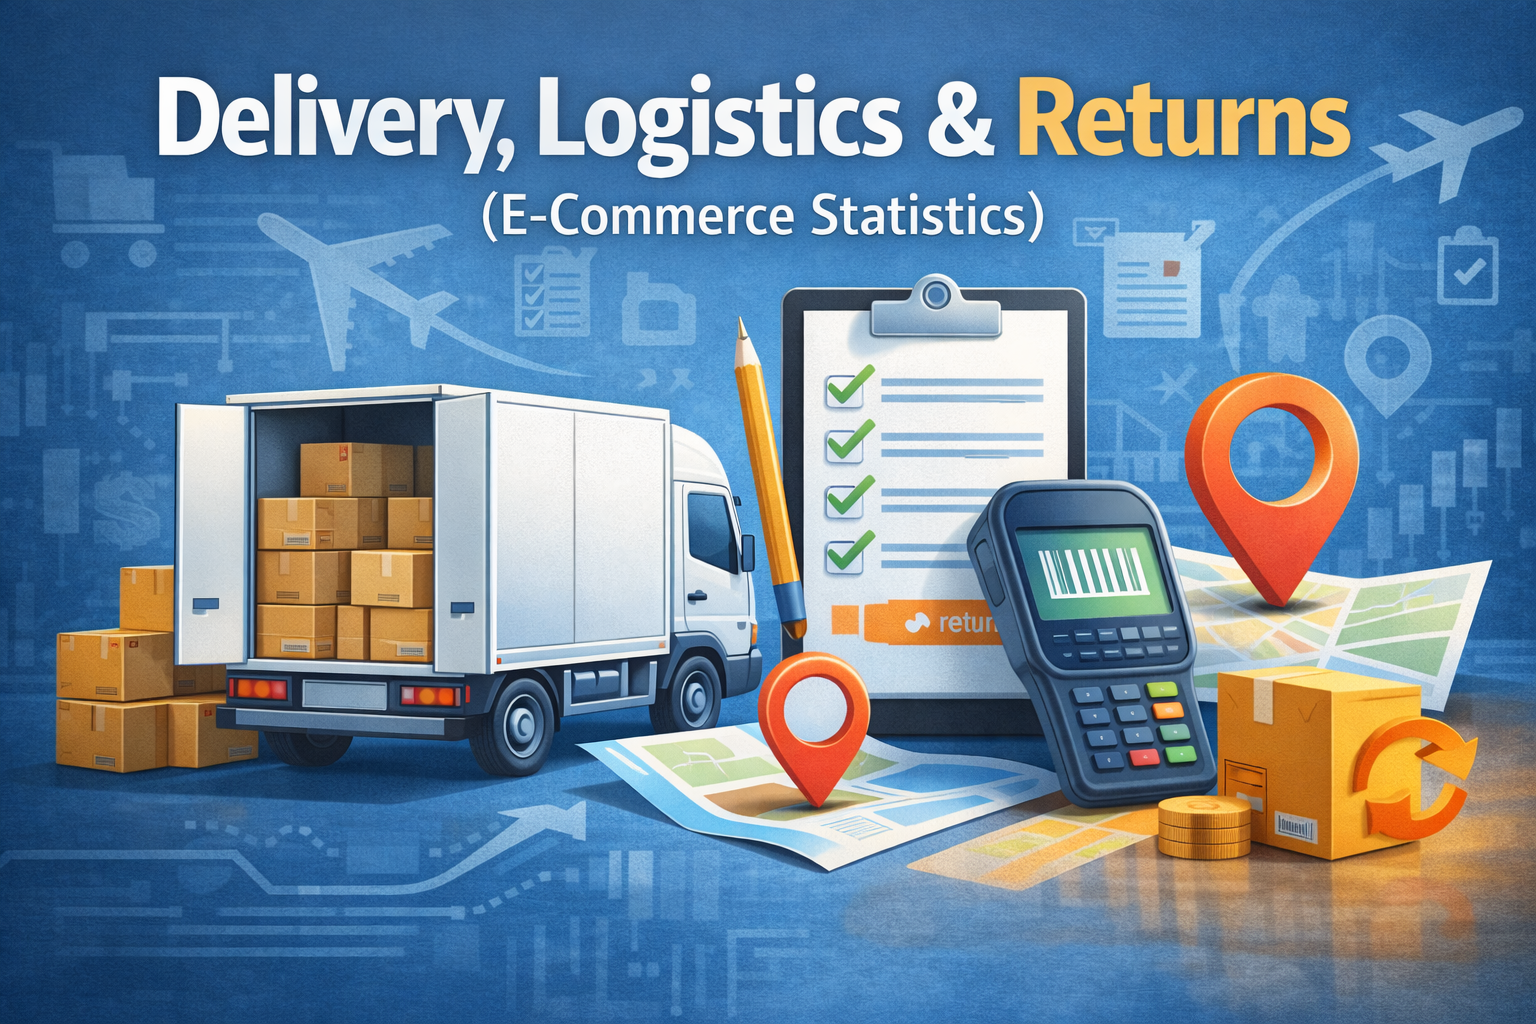
Delivery and returns benchmarks explain what happens after checkout: how shoppers want orders delivered, how often products come back,
how much fulfillment and returns can pressure margin, and how delivery trust affects conversion.
This silo groups delivery method share, return rate, return cost, fulfillment cost, delivery cost, refund time, free returns, damaged delivery, returns fraud and delivery trust benchmarks used in e-commerce reporting and research.
Back to the main hub:
E-commerce Statistics.
For definitions and comparison rules, start with
Methodology.
If you need the core logistics benchmark set first, use
delivery methods share,
return rate benchmarks,
and fulfillment cost share of revenue.
Core delivery and returns benchmarks
Start with these datasets when you need to explain delivery preference, return frequency, fulfillment cost, and post-purchase friction.
Delivery Methods Share
Delivery preference and usage benchmarks across courier delivery, parcel lockers, pickup points, stores, and local delivery methods.
Return Rate Benchmarks
Return rate benchmarks with category context, online-vs-retail framing, and common drivers of product returns.
Fulfillment Cost Share of Revenue
Fulfillment cost benchmarks for understanding how warehousing, picking, packing, shipping and handling affect e-commerce margin.
Delivery Cost as Conversion Barrier
Benchmarks showing how shipping cost, unexpected fees and delivery charges influence checkout completion and cart abandonment.
Refund Time Benchmarks
Benchmarks for how quickly shoppers receive refunds after returns, cancellations, or reverse-logistics processing.
Delivery cost, speed, convenience, customs, trust, and returns policy can affect conversion before the order is placed. Pair this silo with
cart abandonment rate,
conversion rate benchmarks,
payment methods share,
and customs friction in cross-border e-commerce.
Delivery and fulfillment pressure benchmarks
These newer dataset pages focus on the pressure side of logistics: fulfillment cost, delivery cost, returns cost, delivery trust and cross-border customs friction. Use them when you need to explain why logistics can reduce conversion, margin or customer confidence.
E-commerce Fulfillment Cost Share of Revenue
Benchmarks for fulfillment cost as a share of revenue, including warehousing, picking, packing, shipping, handling and operational overhead.
E-commerce Delivery Cost as Conversion Barrier
Data on how delivery cost, hidden shipping fees and unexpected checkout costs influence abandonment and purchase decisions.
E-commerce Returns Cost Pressure Benchmarks
Benchmarks showing how returns affect margin, reverse logistics load, refund timing, resale value and operational capacity.
E-commerce Delivery Trust Impact on Conversion
How trust in delivery providers, delivery promises, tracking and reliability can affect checkout confidence and repeat purchase.
Customs Friction in Cross-border E-commerce
Cross-border customs, duties, taxes and import friction that affect international delivery, checkout confidence and landed cost.
Delivery and returns dataset map
Use this table to choose the right logistics metric for delivery analysis, return policy research, fulfillment cost modeling, reverse-logistics reporting, or e-commerce operations benchmarks.
| Dataset | What it measures | Best used for |
|---|---|---|
| Delivery Methods Share | How delivery choices are split across courier delivery, parcel lockers, pickup points, stores, and other methods. | Delivery preference analysis, checkout localization, logistics strategy, and market comparisons. |
| Return Rate Benchmarks | The share of online orders or products that are returned by customers. | Category benchmarking, margin analysis, returns policy reviews, and reverse-logistics planning. |
| Return Cost per Order | The average operational or financial cost of returns allocated per order. | Margin modeling, free returns decisions, profitability analysis, and logistics cost reporting. |
| Fulfillment Cost Share of Revenue | Fulfillment cost as a share of revenue, usually including warehousing, picking, packing, shipping, handling, or related operations. | Unit economics, logistics cost modeling, margin analysis, 3PL comparisons, and operational planning. |
| Delivery Cost as Conversion Barrier | How shipping cost, extra fees, taxes, or delivery charges influence checkout abandonment and purchase decisions. | Checkout optimization, shipping threshold strategy, free shipping analysis, and conversion audits. |
| Reverse Logistics Time | How long it takes returned items to move back through the returns and processing flow. | Operations planning, warehouse process analysis, resale timing, and customer service expectations. |
| Refund Time Benchmarks | How long customers usually wait to receive refunds after returns or cancellations. | Customer experience reporting, returns policy comparison, and trust-building analysis. |
| Free Returns Prevalence | How common free return policies are across e-commerce stores, markets, or categories. | Returns policy benchmarking, conversion strategy, and category-level customer expectation analysis. |
| Returns Cost Pressure Benchmarks | How returns affect cost, margin, reverse logistics capacity, refund load, resale value, and operations. | Profitability analysis, return policy decisions, logistics cost control, and operational risk reviews. |
| Returns Fraud Rate Benchmarks | The share or cost of returns affected by fraud, abuse, wardrobing, false claims, or policy misuse. | Risk management, returns policy design, fraud prevention, and operational loss analysis. |
| Damaged Delivery Rate Benchmarks | How often orders arrive damaged or are reported as damaged in delivery. | Carrier performance analysis, packaging reviews, customer experience, and claims reduction. |
| Delivery Trust Impact on Conversion | How delivery reliability, carrier trust, tracking, promise clarity, and post-purchase confidence affect conversion. | Checkout trust analysis, carrier selection, UX audits, retention reviews, and delivery promise optimization. |
Cross-border logistics often adds another layer of friction. For customs, duties, taxes and landed-cost issues, see
customs friction in cross-border e-commerce.
What this silo covers
Delivery and returns metrics connect checkout promises with post-purchase experience, operational cost, margin pressure, and customer trust.
Delivery preference
Delivery method share explains which delivery options shoppers prefer or use, including courier delivery, parcel lockers, pickup points, and store pickup.
Fulfillment cost
Fulfillment cost share shows how storage, picking, packing, shipping, handling, software, labor and 3PL costs can affect e-commerce unit economics.
Return frequency
Return rate benchmarks show how often products come back and why category, size, fit, product type, and customer expectations matter.
Reverse logistics
Reverse-logistics time, refund time, return cost, and returns cost pressure benchmarks help explain the operational load behind returns.
Delivery trust
Carrier trust, tracking reliability, delivery promise clarity and expected delivery quality can affect checkout confidence and repeat purchase.
Returns risk
Returns fraud, damaged delivery, policy abuse and cross-border customs friction show where logistics and customer experience can become financial risk.
How to use delivery and returns benchmarks
Use these checks before comparing logistics metrics across sources, categories, markets, fulfillment models, or cross-border setups.
-
Clarify whether “share” means preference or volume.
Survey data often measures what shoppers prefer, while carrier or operator data may measure parcel volume or order share. -
Separate delivery method from delivery promise.
Delivery method share shows how orders are delivered. Delivery speed, cost, convenience, tracking and carrier trust are separate factors that can affect conversion. -
Read fulfillment cost with margin.
Fulfillment cost as a share of revenue matters more when gross margin is thin, AOV is low, returns are high, or shipping subsidies are large. -
Separate online returns from total retail returns.
Online return rates are often higher than overall retail return rates, especially in categories with fit, size, color, or expectation mismatch. -
Add category context.
Fashion, apparel, footwear, electronics, furniture, beauty, and grocery can have very different return profiles. -
Connect logistics to conversion.
Delivery cost, delivery speed, return policy clarity, free returns, refund timing, customs and delivery trust can influence cart abandonment, checkout completion, and repeat purchase. -
Separate domestic and cross-border friction.
Cross-border orders can add customs, duties, taxes, longer delivery promises, localization issues and higher return complexity.
Reference pages:
Methodology •
Glossary •
Sources
Key definitions
Short definitions for the most important delivery and returns terms used across this silo.
Delivery methods share is the percentage of orders, parcels, deliveries, or shopper preferences assigned to each delivery method.
Return rate is the share of orders, products, or sales value returned by customers within a defined period.
Return cost per order estimates the average cost of returns allocated across orders, including shipping, handling, processing, restocking, or lost value depending on the source.
Fulfillment cost share of revenue is the percentage of revenue consumed by fulfillment-related costs such as warehousing, picking, packing, shipping, handling, labor, software, 3PL fees, or operational overhead.
Delivery cost as conversion barrier describes the way shipping cost, delivery fees, taxes, or unexpected checkout charges can reduce purchase completion.
Reverse logistics time is the time needed to move returned products back through inspection, processing, restocking, resale, repair, or disposal.
Refund time is the time between a return, cancellation, or refund request and the customer receiving money back.
Returns cost pressure describes the combined financial and operational burden of return shipping, handling, inspection, refunding, restocking, resale loss, waste, fraud, and support workload.
Delivery trust refers to shopper confidence that an order will arrive on time, through a reliable carrier, with clear tracking, acceptable cost, and a delivery promise the store can keep.
Returns fraud rate measures the share or cost of returns affected by fraud, abuse, false claims, or policy misuse.